
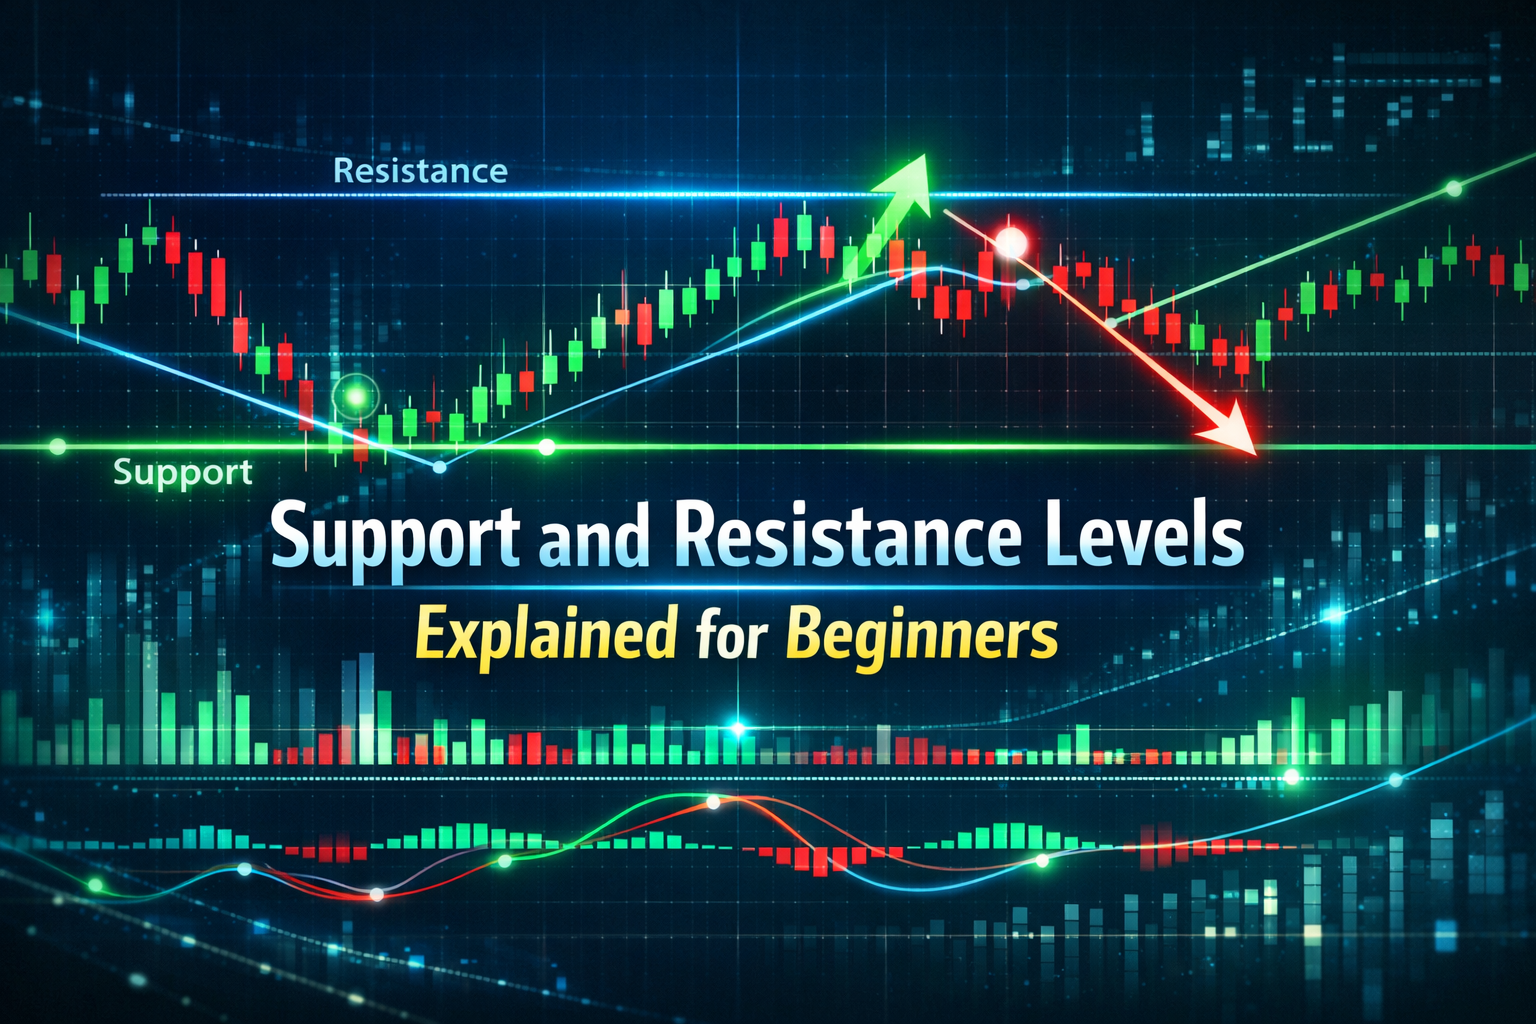
1. Why Support and Resistance Matter in Trading
Support and resistance levels are foundational concepts in trading, yet their importance is often underestimated by beginners. These levels act as invisible barriers on a price chart: support prevents prices from falling lower, while resistance stops prices from rising higher. Understanding these levels allows traders to make smarter decisions and identify high-probability entries and exits—the cornerstone of a profitable trading strategy.
High-Probability Entries and Exits
Knowing where support and resistance lie helps you pinpoint areas where the market is likely to react. For example:
- Entry Points: Buying near strong support levels can increase the probability of a profitable trade because the market often rebounds from these zones.
- Exit Points: Selling near resistance allows you to lock in profits before the market reverses.
This approach reduces guesswork and gives traders more control over their trades, aligning perfectly with the Traffic Domination philosophy: strategy + control = profit optimization.
Connection to Market Traffic, Liquidity, and Momentum
Support and resistance are not just arbitrary lines—they reflect real market behavior.
- Traffic (Market Volume): Levels with heavy trading activity act as stronger support or resistance because many traders have positions there.
- Liquidity: High liquidity near these levels ensures smoother entries and exits, reducing slippage and unexpected losses.
- Momentum: Observing price momentum near support or resistance helps determine whether a level will hold or break.
By integrating these elements into your analysis, you’re not just identifying price points—you’re understanding the market’s flow, the “traffic” of buyers and sellers, and making informed, strategic moves.
Why Beginners Should Focus on Support and Resistance
For new traders, support and resistance provide a clear roadmap in an otherwise chaotic market. Instead of reacting randomly to price swings, you learn to:
- Anticipate market behaviour.
- Time your trades with confidence.
- Avoid impulsive mistakes.
- Maximize profit potential while minimizing risk.
Ultimately, mastering these levels helps you dominate the market with a controlled, strategic approach, turning chaotic price movements into opportunities for profit optimization.
2. Types of Support and Resistance Levels
Support and resistance levels are not all the same. Understanding the types of levels and how they interact with market traffic, liquidity, and momentum is crucial for building a solid trading strategy. Broadly, they fall into two categories: static and dynamic levels.
A. Static Levels
Static support and resistance levels are based on historical price data, such as previous highs and lows. These levels are “fixed” on the chart and do not change over time unless the market forms new highs or lows.
Key Characteristics:
- Represent price zones where the market previously reversed.
- Easier for beginners to identify because they are visually obvious on charts.
- Often coincide with areas of high liquidity, meaning many traders have placed orders near these levels.
Example:
If Bitcoin repeatedly falls to $28,000 and bounces back, $28,000 becomes a strong support level. Traders recognize this and traffic (buying volume) tends to increase near this level, while momentum may slow down as the price approaches support. Conversely, if a stock repeatedly hits $50 and then drops, $50 acts as a resistance level where selling pressure dominates.
Impact of Momentum and Liquidity:
- High momentum can break through static levels if trading volume surges, indicating strong market conviction.
- Liquidity near static levels ensures smoother execution of trades, which is critical for profit optimization.
B. Dynamic Levels
Unlike static levels, dynamic support and resistance levels change over time. They move along with trends and are often determined using trendlines or moving averages.
Key Characteristics:
- Adapt to current market direction.
- Require more observation but provide flexible opportunities for entries and exits.
- Reflect ongoing market momentum and trader behavior.
Examples:
- Trendlines: Drawing a line connecting higher lows in an uptrend creates a dynamic support. Traders can buy near this line while maintaining control over risk.
- Moving Averages: A 50-day moving average often acts as dynamic support in an uptrend. Momentum tends to slow near this average, and liquidity clusters there as traders place stop-loss and take-profit orders.
Impact of Momentum and Liquidity:
- When momentum aligns with dynamic levels, trades have a higher probability of success.
- Low liquidity near these levels may cause false breakouts, so analyzing traffic volume ensures safer entries and exits.
3. How to Identify Support and Resistance
Knowing the types of support and resistance is one thing—but accurately identifying them in real time is what separates successful traders from beginners. Here’s a step-by-step method to spot these crucial levels while incorporating traffic, liquidity, and momentum for better trade decisions.
Step 1: Look for Repeated Price Touches
Support and resistance are created when the market tests a price level multiple times.
- Support Example: If an asset repeatedly drops to $100 but bounces back each time, $100 becomes a support level.
- Resistance Example: If an asset rises to $120 repeatedly but fails to break through, $120 becomes a resistance level.
The key is repetition: the more times a price touches a level without breaking it, the stronger the support or resistance, and the higher the probability of a successful trade.
Why It Matters: This helps beginners identify high-probability entries and exits, giving them control over their trades and reducing guesswork.
Step 2: Identify Areas with High Volume (Traffic)
Not all price touches are equally significant. To validate a level, you need to check market volume, also referred to as traffic on your website’s philosophy.
- High traffic areas indicate strong participation from buyers and sellers.
- Levels with low volume are more likely to fail, leading to false breakouts.
Example: If Bitcoin tests $28,000 with heavy trading volume, it’s more likely to hold as support than a level tested with minimal volume.
Key Insight: Incorporating traffic into your analysis ensures you’re aligning your trades with real market activity, not random price movements.
Step 3: Use Technical Tools
While price touches and volume give you a strong foundation, technical tools provide additional confirmation. Beginners can use:
- Candlestick Patterns: Patterns like hammers, dojis, or engulfing candles near a support/resistance level can indicate potential reversals.
- Moving Averages: Commonly used averages (50-day, 200-day) can act as dynamic support or resistance.
- Trendlines: Draw lines connecting higher lows (uptrend) or lower highs (downtrend) to identify dynamic levels.
Combining these tools with traffic and momentum insights improves the accuracy of your entries and exits, aligning with a strategic, controlled trading approach.
Step 4: Highlight Importance of Market Liquidity
Liquidity is often overlooked by beginners, but it’s a critical factor in identifying real support and resistance levels.
- High liquidity: Price can move smoothly near levels without slippage, making trades safer.
- Low liquidity: Price can spike unpredictably, creating false breakouts or fake reversals.
Tip: Always check order book data or average daily trading volume. A level is stronger when supported by both traffic (volume) and liquidity, ensuring a higher chance of profit optimization.
4. Psychological Factors Behind Support and Resistance
Support and resistance levels are not just technical lines on a chart—they are reflections of human psychology in the market. Understanding the behavioral side of trading helps beginners see why prices react at certain levels and how momentum and market traffic influence these reactions.
Traders’ Behavior: Fear and Greed
Every price movement in the market is ultimately driven by human emotion:
- Fear: When prices approach a known support level, some traders fear further losses and start buying, which creates a natural price floor.
- Greed: When prices approach a resistance level, traders may sell to lock in profits, creating a natural price ceiling.
These emotional responses generate repeated market reactions, making certain support and resistance levels more reliable. Essentially, price barriers are often a direct consequence of collective trader behavior, which also determines where market traffic (volume) and liquidity cluster.
Momentum Spikes and Breakouts
While support and resistance are strong due to trader psychology, they are not unbreakable. Momentum spikes can overpower these levels:
- A sudden surge in buying momentum can push prices above resistance, signaling a breakout.
- Likewise, heavy selling pressure can drive prices below support, triggering a breakdown.
Example: If a stock is trading near a strong resistance of $50, but a major news event causes a sudden influx of buyers (high traffic), the resistance may break, and momentum can carry the price significantly higher.
Key Insight: Understanding momentum in relation to traffic and liquidity helps traders anticipate potential breakouts or reversals rather than being caught off guard.
Linking Psychology to Strategy Execution
At TrafficDomination.net, we emphasize that trading is not just about identifying levels—it’s about controlling your reactions:
- By recognizing that fear and greed drive support and resistance, traders can remain calm and stick to their strategic plan.
- Reacting impulsively to spikes in momentum often leads to mistakes.
- Maintaining control ensures better profit optimization and reinforces a disciplined approach to the market.
Pro Tip for Beginners:
- Observe how prices react at key levels over multiple time frames.
- Avoid panic buying or selling at the first sign of momentum.
- Use these observations to refine your strategy, control, and entry/exit decisions.
5. Using Support and Resistance in Your Trading Strategy
Identifying support and resistance is only the first step. The real power comes from integrating these levels into a structured trading strategy that leverages traffic, liquidity, and momentum. This ensures you not only identify high-probability trades but also execute them effectively for profit optimization and market domination.
Step 1: Combine Support/Resistance with Volume (Traffic) Analysis
Volume, or market traffic, is critical for validating support and resistance levels:
- High traffic at a support level indicates strong buyer interest, making it more likely to hold.
- High traffic at a resistance level signals strong selling pressure, increasing the chance of a reversal.
Example: If a cryptocurrency repeatedly bounces at $30,000 and volume spikes each time it approaches this level, you can plan entries around this support with confidence.
Key Tip: Use volume histograms or order book data to identify where traffic is concentrated. Levels with low volume may fail easily, leading to false signals.
Step 2: Assess Liquidity
Liquidity ensures that your trades can be executed smoothly without slippage or unexpected price gaps. Support and resistance levels in high-liquidity zones are more reliable:
- High liquidity near support allows for larger buy orders without drastically moving the price.
- High liquidity near resistance lets sellers exit positions efficiently.
Pro Tip: Check average daily trading volume or bid-ask spreads. Trading near low-liquidity levels increases risk and reduces control over outcomes.
Step 3: Incorporate Momentum Indicators
Momentum helps you determine whether support or resistance will hold or break. Popular indicators include:
- Relative Strength Index (RSI): Shows overbought or oversold conditions near key levels.
- MACD (Moving Average Convergence Divergence): Confirms trend direction and strength.
- Stochastic Oscillator: Indicates potential reversals.
Example: A stock approaching resistance with a weakening RSI may signal a reversal, while strong momentum could break the resistance. Combining momentum insights with traffic and liquidity data ensures higher-probability trades.
Step 4: Build a Structured Trade Plan
To truly dominate the market, support and resistance should be part of a comprehensive trading plan:
- Identify key levels using historical data and technical tools.
- Validate levels with traffic (volume) and liquidity.
- Check momentum to anticipate breakouts or reversals.
- Define entries and exits in advance, avoiding impulsive decisions.
- Set risk management rules (stop-loss and take-profit levels).
Key Insight: Following a structured plan gives you control over trades, turning support and resistance levels into actionable opportunities for profit optimization.
6. Confirming Breakouts and Reversals
Support and resistance levels are valuable tools, but they are not infallible. Prices often test these levels before deciding whether to reverse or break through. To maximize high-probability trades, it’s essential to confirm breakouts and reversals using volume, momentum, and liquidity. This ensures you don’t get caught in false signals and can maintain strategic control over your trades.
1. Look for a Volume Surge at Breakout
Volume, or market traffic, is one of the strongest confirmations of a genuine breakout or reversal:
- Breakout confirmation: When the price moves above resistance (or below support) with a significant increase in volume, it indicates strong participation from buyers or sellers.
- False breakout warning: A price crossing a level with low volume often fails to sustain momentum and can quickly reverse.
Example:
If a stock breaks above $50 resistance with trading volume doubling the average, it’s likely a real breakout. Conversely, if the price breaks the same level on very low volume, it could be a trap.
Key Takeaway: Always combine traffic (volume) analysis with price movement to confirm a breakout before entering a trade.
2. Confirm with Momentum Trends
Momentum indicators help determine whether the market has the strength to continue in the breakout direction:
- Indicators to use: RSI, MACD, and moving average crossovers.
- Positive momentum: Confirms that buyers or sellers are in control, supporting the breakout or continuation of a reversal.
- Weak momentum: Suggests the breakout may fail, signaling a potential reversal.
Example:
A cryptocurrency breaking below support with MACD showing strong bearish momentum is more likely to continue its downward move. If momentum is weak, a bounce back may occur instead.
3. Avoid Low-Liquidity Traps
Liquidity ensures smooth execution of trades without unexpected price swings. Low liquidity near support or resistance can create false breakouts or fake reversals:
- High-liquidity zones: Prices move predictably, confirming the level’s significance.
- Low-liquidity zones: A few large orders can temporarily push the price, creating misleading signals.
Example:
A small-cap stock may appear to break resistance due to minimal trading volume, but without enough liquidity, the price can quickly revert. Monitoring liquidity prevents these traps.
Key Takeaway: Always cross-check traffic (volume) and liquidity when confirming breakouts and reversals to protect your strategy and maintain control over trades.
7. Common Mistakes Beginners Make
Even though support and resistance are essential tools, beginners often make avoidable mistakes that reduce their chances of profit optimization. Understanding these common errors helps traders stay disciplined and execute their strategies with control and precision.
Mistake 1: Ignoring Volume and Liquidity
Many beginners look at price charts alone without considering volume (traffic) or liquidity.
- Why it’s a problem: A price may appear to bounce off support or break resistance, but if there’s low volume or liquidity, it might be a false signal.
- Consequence: Entering a trade without confirming traffic can lead to losses or missed opportunities.
Example:
A stock tests a $50 support level but only a handful of shares trade at that price (low liquidity). The price quickly drops to $48, causing early buyers to panic sell. If the trader had considered traffic and liquidity, they could have avoided this trap.
Mistake 2: Relying Solely on Support and Resistance Without Strategy
Support and resistance lines are tools, not a complete plan. Beginners often act on levels without a structured strategy, ignoring entries, exits, and risk management.
- Why it’s a problem: Price can react unpredictably near levels, especially during momentum surges or low liquidity periods.
- Consequence: Blindly trading levels increases stress and leads to inconsistent profits.
Example:
A beginner buys a cryptocurrency at $30,000 support without checking momentum or setting stop-loss levels. The price briefly dips below support due to a temporary market panic, triggering unnecessary losses. A strategic plan would have prevented this mistake.
Mistake 3: Not Tracking Momentum Changes
Support and resistance levels can hold or break depending on market momentum. Ignoring momentum is a common beginner mistake.
- Why it’s a problem: Price movements that seem to respect support/resistance can quickly fail if momentum shifts.
- Consequence: Traders may enter too early or exit too late, missing profit optimization opportunities.
Example:
A trader sees a stock near $50 resistance and assumes it will reverse. However, strong bullish momentum pushes the stock to $55 within hours. The trader missed a high-probability breakout due to ignoring momentum indicators.
Real-Life Scenario: Missed Profit Optimization
Imagine a trader identifies a strong support level at $100 for a popular stock. They place a small trade but ignore:
- Traffic (volume): The level shows high trading activity, signaling a larger potential move.
- Liquidity: The stock has high liquidity, meaning large positions could be entered smoothly.
- Momentum: Momentum indicators suggest an imminent upward breakout.
Because the trader didn’t combine these factors, they enter too small and miss out on a significant profit as the price surges to $110.
Lesson: Avoiding these beginner mistakes by integrating traffic, liquidity, and momentum into your strategy ensures better control and profit optimization, exactly the approach promoted by TrafficDomination.net.
8. Tools and Indicators to Enhance Accuracy
While support and resistance levels provide the foundation for trading, using the right tools and indicators can significantly improve the accuracy of your entries and exits. For beginners, combining technical indicators with volume (traffic) and liquidity analysis helps reduce false signals and maximize profit optimization.
1. Technical Indicators for Beginners
Technical indicators are mathematical calculations based on price, volume, and momentum. Here are three key indicators that enhance the reliability of support and resistance levels:
a. RSI (Relative Strength Index)
- Measures whether an asset is overbought or oversold.
- RSI above 70 indicates overbought conditions (potential reversal near resistance).
- RSI below 30 indicates oversold conditions (potential bounce near support).
- Benefit: Helps beginners confirm whether a level is likely to hold or break.
b. MACD (Moving Average Convergence Divergence)
- Shows trend direction and momentum strength.
- A bullish crossover (MACD line crossing above the signal line) near support can confirm a buying opportunity.
- A bearish crossover near resistance can signal a potential exit or shorting opportunity.
- Benefit: Combines momentum insights with support/resistance to reduce risky trades.
c. Bollinger Bands
- Plots price bands above and below a moving average, showing volatility.
- When price touches the lower band near support, it may bounce back.
- When price touches the upper band near resistance, a reversal is possible.
- Benefit: Adds context for price extremes, helping traders manage entries and exits more accurately.
2. Combining Technical Indicators with Volume (Traffic)
Indicators alone are not enough. High-quality trades require confirmation from market traffic (volume):
- High volume at support/resistance levels: Confirms the significance of the level.
- Low volume at breakouts: Warns that the move may fail.
Example: A stock approaches resistance with a high RSI, but volume is low. The breakout is less likely to succeed, signaling traders to wait or adjust position size.
Benefit: Volume analysis ensures that trades are aligned with real market activity, giving beginners more control and confidence.
3. Liquidity Tracking Tools
Liquidity affects the ease of executing trades and the reliability of support and resistance levels:
- Tools like order books and average daily volume charts help identify high-liquidity zones.
- Trading in low-liquidity areas increases the risk of slippage or false breakouts.
- Combining liquidity analysis with support/resistance ensures smoother entries and exits.
Benefit: Incorporating liquidity into your strategy strengthens your profit optimization potential and reduces unexpected losses.
4. How to Use These Tools Together
A beginner-friendly workflow could look like this:
- Identify support and resistance levels on the chart.
- Check volume (traffic) at these levels to ensure high participation.
- Use RSI, MACD, and Bollinger Bands to confirm momentum and potential reversals.
- Verify liquidity to ensure smooth trade execution.
- Enter the trade with a structured plan, including stop-loss and take-profit levels.
By combining technical indicators, traffic, liquidity, and momentum analysis, beginners can trade with greater accuracy, control, and profitability—turning support and resistance into a powerful tool for market domination.
9. Example Trade Using Support and Resistance
Understanding support and resistance is one thing—but applying them in a real trade scenario brings true clarity. Here’s a step-by-step example that demonstrates how to combine traffic, liquidity, and momentum into a structured plan for profit optimization.
Step 1: Identify Support and Resistance
The first step is to plot key levels on your chart:
- Look for historical highs and lows (static levels).
- Check trendlines or moving averages for dynamic levels.
- Example: A stock has repeatedly bounced at $50 (support) and struggled to move above $60 (resistance).
Tip: Mark these levels clearly, as they will guide your entries and exits.
Step 2: Check Market Traffic and Liquidity
Once you identify the levels, confirm their significance using volume (traffic) and liquidity:
- High traffic near support/resistance: Indicates strong trader participation and increases the reliability of the level.
- High liquidity: Ensures you can execute trades smoothly without slippage.
Example: The $50 support level shows triple the average daily volume, indicating a strong buying zone. The order book is thick, meaning liquidity is high and large trades won’t move the market unpredictably.
Step 3: Confirm Momentum Direction
Next, evaluate momentum indicators to anticipate whether the price is likely to respect or break the level:
- Use RSI to see if the stock is oversold or overbought.
- Use MACD or moving averages to confirm trend direction.
- Example: The RSI shows oversold conditions at $50, and MACD indicates bullish momentum.
Insight: This confirms that the support is likely to hold and a bounce is probable.
Step 4: Execute Trade with Clear Entry/Exit
With support, traffic, liquidity, and momentum confirmed, you can enter the trade with a controlled strategy:
- Entry: Buy near $50 support.
- Stop-Loss: Place just below $49.50 to limit risk.
- Target/Exit: Aim near $60 resistance for potential profit.
Tip: Ensure your position size aligns with your risk management plan. This disciplined approach prevents emotional decisions and protects your capital.
Step 5: Highlight Profit Optimization Using Controlled Strategy
By combining all elements—support/resistance, traffic, liquidity, and momentum—you create a high-probability trade:
- You entered at a strong support zone with high traffic and liquidity.
- Momentum confirmed the bounce, increasing the likelihood of reaching your target.
- Stop-loss ensures losses are controlled if the market moves unexpectedly.
Outcome: The trade maximizes profit potential while minimizing risk, demonstrating how strategy + control = market domination, the core principle of TrafficDomination.net.
Technical Analysis vs Fundamental Analysis: Which Is Better?
10. Summary and Key Takeaways
Support and resistance levels are more than just lines on a chart—they are essential tools for understanding market behavior and executing high-probability trades. When used correctly, these levels give traders strategic control over the market, helping them dominate price movements and optimize profits consistently.
Support and Resistance: The Foundation of Market Domination
- Support levels act as floors where buying interest prevents prices from falling further.
- Resistance levels act as ceilings where selling pressure prevents prices from rising.
- Together, these levels provide guidance for entries and exits, turning chaotic price movements into actionable opportunities.
- Key Insight: Mastering support and resistance is the first step toward dominating the market with confidence.
Always Integrate Traffic, Liquidity, and Momentum
To truly maximize the effectiveness of support and resistance:
- Traffic (Volume): Check trading activity near levels. High traffic confirms the importance of support/resistance and increases the probability of successful trades.
- Liquidity: Ensure sufficient liquidity at key levels to avoid slippage and execute trades smoothly.
- Momentum: Analyze momentum trends to determine whether levels are likely to hold or break.
Key Takeaway: Levels alone are not enough—combining traffic, liquidity, and momentum transforms your analysis into actionable, high-probability strategies.
Strategy + Control = Consistent Profit Optimization
At TrafficDomination.net, we emphasize that successful trading is not about luck—it’s about having a structured plan and maintaining control:
- Strategy: Identify levels, validate them, and define entries and exits.
- Control: Stick to your plan, manage risk, and avoid impulsive decisions.
- Profit Optimization: When strategy and control are applied together, you consistently maximize your trading results.
Example: A trader entering a trade near support with high traffic and liquidity, confirming momentum, and executing with defined stop-loss and take-profit levels has a higher chance of profit while minimizing risk.
Encouragement for Beginners
- Practice identifying support and resistance levels on different timeframes.
- Confirm levels with volume (traffic), liquidity, and momentum indicators.
- Keep a trading journal to track successes, mistakes, and patterns.
- Remember: mastery comes with repetition and disciplined application, not guesswork.
Final Thought: By combining these insights, beginners can transition from reactive trading to a structured, controlled approach, ultimately dominating the market and achieving consistent profit optimization.