
1. Introduction to Fibonacci Retracement in Trading
In the world of trading, precision and timing are everything. One of the most reliable tools that traders use to anticipate market behavior is Fibonacci retracement. This technical analysis tool is specifically designed to help traders identify potential support and resistance levels during market corrections. By using Fibonacci retracement, traders can better predict where a price may pause, reverse, or continue its trend, giving them a critical edge in the market.
Understanding Market Movements
Markets rarely move in a straight line. Instead, price action tends to follow a wave-like structure that alternates between impulse moves—strong directional trends—and pullbacks—temporary retracements against the trend. These pullbacks are natural and provide opportunities for traders to enter or exit positions strategically. Fibonacci retracement measures these pullbacks and highlights the zones where price is likely to react, allowing traders to anticipate reversals or trend continuations.
The Connection to Traffic Domination
For traders who aim for Traffic Domination, the Fibonacci retracement tool is invaluable because it aligns directly with your core trading philosophy:
- Market Traffic – Understanding how volume, liquidity, and momentum flow at key retracement levels helps traders identify high-probability entry and exit points. For example:
- Volume spikes often confirm strong reactions at Fibonacci levels.
- Liquidity zones can indicate where institutional orders might be concentrated.
- Momentum indicators show whether the trend is likely to continue or reverse.
- Market Domination – When combined with a structured approach, Fibonacci retracement supports strategy, control, and profit optimization. Traders can:
- Develop a clear strategy for entries and exits.
- Maintain control over risk by placing stops and profit targets at logical levels.
- Optimize profits by targeting high-probability price reversals.
Why Combining Fibonacci Levels with Market Traffic Signals Matters
While Fibonacci retracement alone can provide potential price zones, its power multiplies when combined with market traffic analysis. By observing how price interacts with volume, liquidity, and momentum at each retracement level, traders gain a deeper insight into real market behavior, enabling them to execute trades with confidence and precision.
For instance, a price retracing to the 61.8% Fibonacci level accompanied by increasing volume and a momentum reversal signal indicates a strong opportunity for market domination. Conversely, a weak reaction at a retracement level may signal that momentum is fading, prompting traders to remain patient or avoid entering prematurely.
What This Article Will Cover
In the sections that follow, we will break down:
- How Fibonacci retracement levels are calculated and applied
- The key retracement levels every trader should know
- How to combine these levels with market traffic signals like volume, liquidity, and momentum
- Strategic approaches for dominating the market and optimizing profits
By the end of this guide, you will understand not just the mechanics of Fibonacci retracement, but also how to use it as part of a comprehensive Traffic Domination strategy, giving you both the analytical insight and tactical control to maximize your trading success.
2. Understanding the Fibonacci Sequence and Golden Ratio
To effectively use Fibonacci retracement in trading, it’s essential to first understand the mathematical foundation behind it: the Fibonacci sequence and the Golden Ratio. These concepts are not just numbers—they are patterns that naturally occur in markets, helping traders anticipate price corrections and trend continuations.
The Fibonacci Sequence
The Fibonacci sequence is a series of numbers discovered by the 13th-century Italian mathematician Leonardo Fibonacci. Each number in the sequence is the sum of the two preceding numbers, forming a naturally growing pattern:
1, 1, 2, 3, 5, 8, 13, 21, 34, 55…
This sequence appears in nature, art, architecture, and importantly for traders, in financial markets. Price movements in markets often mimic these natural proportions, making Fibonacci retracement a powerful predictive tool.
The Golden Ratio
As the Fibonacci sequence progresses, the ratio between consecutive numbers begins to approach 0.618, commonly known as the Golden Ratio.
- For example:
- 13 ÷ 21 ≈ 0.619
- 21 ÷ 34 ≈ 0.617
This ratio is the basis for the most critical Fibonacci retracement levels used in trading. It represents a natural balance point where price often finds support or resistance during corrections.
Key Fibonacci Retracement Levels
In trading, the following ratios derived from the Fibonacci sequence are widely used to measure pullbacks within a trend:
- 23.6% – Minor retracement, indicates strong market momentum.
- 38.2% – Moderate retracement, often a healthy correction in a trending market.
- 50% – Psychological level, frequently acting as a midpoint correction.
- 61.8% – The Golden Ratio, a critical zone for major reversals or trend continuation.
- 78.6% – Deep retracement, signals strong correction but potential for trend resumption.
These levels are plotted on charts to anticipate where price may react, providing traders with high-probability entry and exit points.
Why Fibonacci Ratios Work in Markets
The key principle behind Fibonacci retracement is simple: markets tend to retrace a portion of a move before continuing the main trend.
- During an uptrend, price may pull back to a Fibonacci level before buyers re-enter.
- During a downtrend, price may retrace upward to a Fibonacci level before sellers regain control.
This is where Traffic Domination comes into play: by combining Fibonacci levels with market traffic signals, traders can identify areas where volume enters, liquidity pools exist, and momentum temporarily pauses.
For example:
- A 61.8% retracement that coincides with a high liquidity zone can indicate a potential reversal point.
- A 38.2% retracement with rising momentum and volume may suggest the trend will resume.
Strategic Application
Understanding these ratios gives traders strategic control over trade decisions:
- Entry Points: Place trades at retracement levels where momentum and volume confirm potential reversals.
- Exit Targets: Use Fibonacci extensions or previous highs/lows for profit-taking.
- Risk Management: Place stops slightly beyond key Fibonacci levels to protect against unexpected price movements.
By mastering Fibonacci ratios, traders gain more than just technical insight—they gain control over market timing, liquidity exploitation, and profit optimization, which are the cornerstones of Traffic Domination.
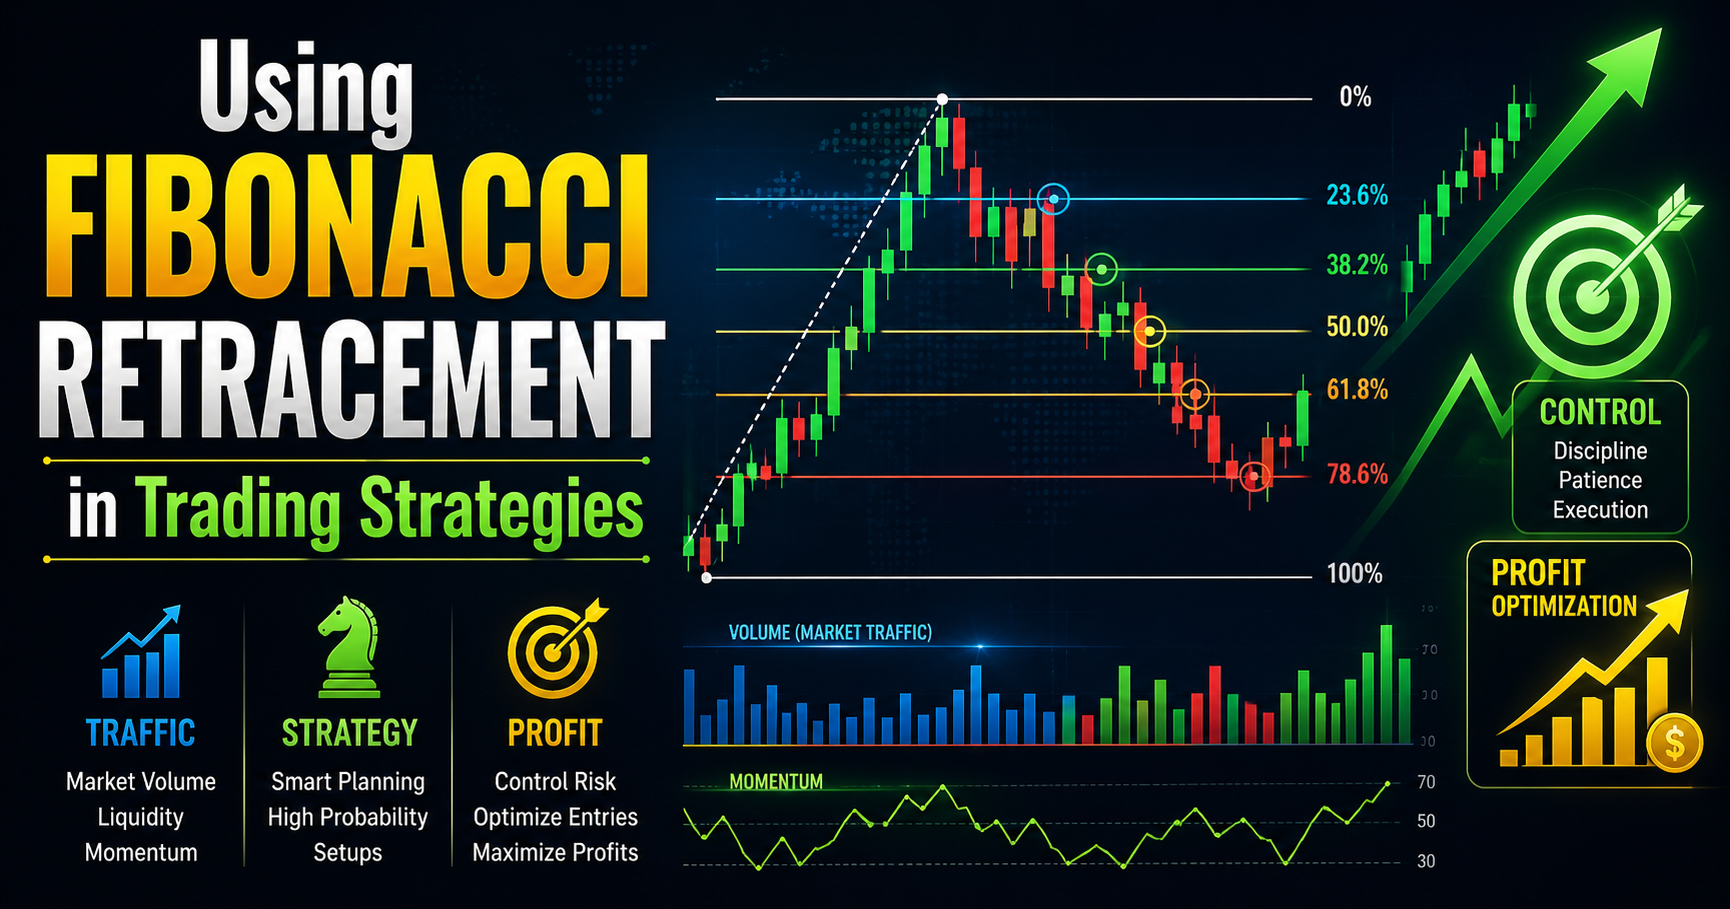
3. Key Fibonacci Retracement Levels Every Trader Should Know
Fibonacci retracement levels are more than just lines on a chart—they are strategic zones where price is likely to react, giving traders an edge in understanding market behavior. By using the Fibonacci tool, traders can automatically plot horizontal levels between a swing high and swing low, highlighting areas where volume surges, liquidity pools exist, and momentum shifts occur.
Each retracement level represents a potential reaction zone—a place where traders can anticipate support, resistance, or trend continuation, allowing for strategic market domination.
23.6% – Shallow Retracement
- Market Context: A 23.6% retracement occurs when the market is strongly trending and experiences only a minor pullback.
- Implication for Traders: This level often signals strong momentum, where buyers or sellers remain firmly in control.
- Traffic Domination Insight:
- Volume: Low-to-moderate retracement volume confirms the trend is healthy.
- Liquidity: Few liquidity traps exist at this level, so trades can be entered with lower risk.
- Momentum: The trend momentum remains strong, often leading to a quick bounce.
- Strategic Action: Traders can look for quick continuation trades, entering with tight stops and aiming for small, efficient profit targets.
38.2% – Moderate Pullback
- Market Context: A 38.2% retracement represents a healthy correction within a strong trend.
- Implication for Traders: Price often pauses or consolidates around this level, which can act as dynamic support or resistance.
- Traffic Domination Insight:
- Volume: Moderate trading volume at this level can indicate participation by institutional traders.
- Liquidity: Some liquidity pools may exist here, providing opportunities to capture entries with favorable risk/reward.
- Momentum: Momentum indicators often show a temporary slowdown, signaling a good entry point for trend-following traders.
- Strategic Action: Enter trades aligned with the main trend, using this retracement as a high-probability zone for both swing and intraday strategies.
50% – Psychological Level
- Market Context: The 50% retracement is not an official Fibonacci ratio, but it is widely respected by traders.
- Implication for Traders: Price often retraces half of the previous move, which is psychologically significant in financial markets.
- Traffic Domination Insight:
- Volume: Watch for increasing volume at this level, signaling strong market participation.
- Liquidity: Many stop orders and limit entries may cluster here, creating potential liquidity zones.
- Momentum: Momentum may pause briefly, allowing traders to enter with controlled risk.
- Strategic Action: Use this level for trend continuation entries or scaling positions, while keeping stop-loss placement logical and disciplined.
61.8% – Golden Ratio
- Market Context: The 61.8% level, known as the Golden Ratio, is the most critical retracement level in trading.
- Implication for Traders: This level often serves as a major decision point, where markets either reverse or continue the trend strongly.
- Traffic Domination Insight:
- Volume: High volume near 61.8% indicates institutional participation and serious liquidity.
- Liquidity: Large stop-loss clusters often exist, which can trigger sharp price reactions.
- Momentum: Momentum indicators may reverse here, signaling a strong potential reversal or trend continuation.
- Strategic Action: Traders can execute high-probability trades, entering near this level with well-defined stops and profit targets, fully leveraging both market traffic and strategic control.
78.6% – Deep Retracement
- Market Context: A 78.6% retracement indicates a deep correction, often approaching the origin of the trend.
- Implication for Traders: If price holds this level, it suggests the trend may resume; if it breaks, it often signals a trend reversal.
- Traffic Domination Insight:
- Volume: Volume spikes here can indicate aggressive buying or selling activity.
- Liquidity: Major liquidity pools often exist, providing opportunities for smart entries or exits.
- Momentum: Momentum may show exhaustion before resuming the trend or reversing completely.
- Strategic Action: Use this level with strict risk management. Enter trades only if traffic signals confirm trend continuation or reversal.
4. How to Draw Fibonacci Retracement Correctly
Correctly drawing Fibonacci retracement levels is essential for accurate market analysis. A misdrawn Fibonacci tool can lead to false signals, missed opportunities, or poorly timed trades. When applied correctly, it allows traders to anticipate potential support and resistance zones, aligning perfectly with the Traffic Domination philosophy of mastering market traffic (volume, liquidity, momentum) and strategic control.
Here’s a step-by-step guide to drawing Fibonacci retracement accurately:
Step 1: Identify the Market Trend
Before applying Fibonacci, you must first analyze the market trend. Understanding the trend ensures that you draw retracements in the correct direction, increasing the probability of successful trades.
Market conditions to consider:
- Uptrend: Price is making higher highs and higher lows.
- Downtrend: Price is making lower highs and lower lows.
- Consolidation: Price moves sideways; Fibonacci retracement may produce less reliable signals.
Traffic Domination Insight:
- In trending markets, retracements often coincide with liquidity zones and momentum shifts.
- Attempting to trade Fibonacci during consolidation without confirming traffic signals increases the risk of false breakouts or whipsaws.
Step 2: Identify Swing High and Swing Low
The next step is to locate the most recent major swing points:
- Swing High: The highest point of the trend before a pullback begins.
- Swing Low: The lowest point of the trend before a corrective move ends.
Why this matters:
- Choosing correct swing points ensures that retracement levels correspond to real market reactions rather than random fluctuations.
- Misidentifying swings can misalign key volume, liquidity, and momentum zones, reducing the effectiveness of the Fibonacci tool.
Traffic Domination Tip:
- Look for swings supported by high volume and significant momentum. These indicate that institutional traders may have participated, creating strong reaction zones.
Step 3: Apply the Fibonacci Tool
Once the swing points are identified, it’s time to plot the retracement levels using your charting software. The application depends on the trend:
- In an Uptrend: Draw the Fibonacci from swing low → swing high.
- This sets up potential support levels where price may pull back before continuing upward.
- In a Downtrend: Draw from swing high → swing low.
- This sets up potential resistance levels where price may retrace upward before resuming the downtrend.
Automatic Levels: Most charting platforms will display key Fibonacci levels (23.6%, 38.2%, 50%, 61.8%, 78.6%) once you apply the tool.
Traffic Domination Insight:
- These levels highlight zones where liquidity accumulates, momentum slows, or volume spikes.
- They provide actionable points for entry, exit, and risk management within your trading strategy.
Step 4: Observe Price Reaction
After drawing the retracement levels, carefully watch how the price reacts as it approaches each level.
Key observations to make:
- Price Reversal: Indicates a strong reaction zone where buyers or sellers dominate.
- Breakthrough: A break beyond a Fibonacci level with volume confirms trend continuation.
- Consolidation: Price may hover near a level, signaling a temporary pause in momentum and an opportunity for a strategic entry.
Traffic Domination Application:
- Combine retracement levels with volume spikes, momentum indicators, and liquidity clusters to confirm high-probability trading zones.
- This approach ensures strategic control over trade timing, risk, and profit optimization rather than relying on retracement levels alone.
5. Using Fibonacci Retracement to Identify Support and Resistance
One of the most powerful applications of Fibonacci retracement is its ability to identify dynamic support and resistance levels. Unlike static price levels that remain fixed, Fibonacci levels adjust according to recent market swings, giving traders real-time insight into where price may react, pause, or reverse.
By understanding how markets interact with these levels, traders gain the ability to predict high-probability reaction zones, manage risk more effectively, and optimize entry and exit timing, which is the essence of Traffic Domination trading.
How Fibonacci Levels Act as Support and Resistance
- Support: During an uptrend, retracement levels act as zones where buyers re-enter the market. Price often pauses or reverses at these levels, providing opportunities for trend continuation trades.
- Resistance: During a downtrend, retracement levels act as zones where sellers re-enter. Price may stall or reverse downward, offering strategic points to capture high-probability short positions.
Dynamic Nature: Unlike fixed support or resistance levels, Fibonacci zones are based on recent swing highs and lows, meaning they reflect the current market structure. This adaptability allows traders to respond to changing liquidity and momentum more effectively.
Example Scenario
Consider a market scenario where a strong trend develops:
- Price rallies strongly in an uptrend.
- Market retraces to the 38.2% or 50% Fibonacci level.
- Buyers re-enter the market as they recognize this zone as support.
- Trend continues, providing an opportunity for traders to enter with confidence.
This simple sequence illustrates how Fibonacci retracement levels can serve as predictive reaction zones, rather than relying on guesswork or lagging indicators.
Why This Matters for Traffic Domination
For traders focused on Traffic Domination, combining Fibonacci retracement with market traffic analysis (volume, liquidity, momentum) is key to maximizing profits:
- Predict High-Probability Reaction Zones:
- Fibonacci levels indicate areas where price is likely to reverse or stall.
- By analyzing volume, traders can confirm whether these levels are actively supported by market participants.
- Identify Market Liquidity Areas:
- Major institutional orders often cluster near Fibonacci levels.
- Recognizing these liquidity pools allows traders to anticipate stop hunts or sharp reversals.
- Optimize Entry Timing:
- Combining Fibonacci levels with momentum indicators (e.g., RSI, MACD) ensures that traders enter positions when the trend is most likely to resume.
- This reduces risk and improves profit-to-loss ratios.
Best Practices for Using Fibonacci Support and Resistance
- Confirm with Traffic Signals: Don’t rely solely on Fibonacci levels—check volume spikes, momentum shifts, and liquidity zones.
- Use Multiple Timeframes: Higher timeframe Fibonacci levels often carry more weight, acting as stronger support or resistance.
- Align With Trend Direction: Retracements are more reliable when used in trending markets rather than during consolidation phases.
By integrating these practices, traders can capture stronger trading opportunities, reduce false signals, and maintain strategic control over their trades, which are essential for consistent profit optimization.
How Economic News Affects Forex Trading
6. Combining Fibonacci with Market Traffic (Volume, Liquidity, Momentum)
While Fibonacci retracement levels are highly effective on their own, their true power emerges when combined with market traffic analysis. Traffic Domination trading is all about leveraging market volume, liquidity, and momentum to make high-probability trading decisions. When these factors converge at key Fibonacci levels, traders can gain strategic control over entries, exits, and risk management, significantly increasing the probability of success.
1. Volume Confirmation
Volume is a critical indicator of market participation. A Fibonacci level becomes far more meaningful when accompanied by increasing volume, as it reflects the strength and conviction of market participants.
- High Volume at Retracement Levels:
Indicates that many traders or institutions are acting at this price zone. It confirms that the Fibonacci level is not just a theoretical line but a real area of market interest. - Low Volume at Retracement Levels:
Suggests weak participation and may signal that the price is likely to break through the level rather than reverse.
Traffic Domination Insight:
Volume analysis allows traders to filter out weak signals and focus only on Fibonacci zones that coincide with strong market traffic, improving trade precision and reducing risk.
2. Liquidity Zones
Fibonacci retracement levels are often hotspots for liquidity, where large institutional orders accumulate. These areas frequently generate market reactions, such as:
- Stop Hunts: Price temporarily spikes to trigger stop-loss orders clustered near Fibonacci levels before continuing the trend.
- Liquidity Sweeps: Smart money may manipulate price around these levels to capture liquidity before driving momentum in the trend direction.
- Market Reversals: Major buy or sell orders can cause sudden reversals at these zones.
Traffic Domination Insight:
By recognizing liquidity zones at Fibonacci levels, traders can anticipate where the market is likely to react strongly, allowing them to enter trades with strategic control and profit optimization in mind.
3. Momentum Indicators
Momentum indicators help confirm whether a retracement at a Fibonacci level is likely to result in trend continuation or reversal. Key tools include:
- RSI (Relative Strength Index): Detects overbought or oversold conditions, showing if price is ready to bounce from a Fibonacci level.
- MACD (Moving Average Convergence Divergence): Confirms trend strength or divergence, signaling potential reversal points.
- Moving Averages: Short-term and long-term moving averages help identify whether the overall momentum supports trend continuation.
Traffic Domination Insight:
When momentum indicators align with Fibonacci retracement and high volume/liquidity zones, it creates a triple-confirmation setup—a hallmark of disciplined, high-probability trading.
4. Integrating Fibonacci with Market Traffic for Traffic Domination
By combining Fibonacci retracement levels with volume, liquidity, and momentum, traders create a complete Traffic Domination trading framework:
- Identify Fibonacci retracement levels on the chart.
- Check volume at each level to confirm strong market participation.
- Observe liquidity zones where institutional orders may cluster.
- Analyze momentum indicators to validate trend continuation or reversal.
- Enter trades only when all three factors align, maximizing the probability of success.
This integration ensures that trades are not random or purely technical, but based on a strategic understanding of market traffic, providing:
- Better timing for entries and exits
- Higher confidence in trend continuation or reversal
- Optimized profit potential with disciplined risk control
7. Fibonacci Trading Strategies for Market Domination
Fibonacci retracement is not just a tool for measuring price pullbacks—it can form the backbone of high-probability trading strategies. When combined with market traffic signals (volume, liquidity, momentum), Fibonacci-based strategies provide traders with control, precision, and optimized profit potential, which are the hallmarks of Traffic Domination.
Here are some of the most effective strategies for leveraging Fibonacci retracement:
1. Trend Continuation Strategy
The Trend Continuation Strategy is designed for markets moving in a strong directional trend. It allows traders to enter the market during a temporary pullback, taking advantage of the underlying trend’s momentum.
Step-by-Step Execution:
- Identify a Strong Trend:
- Look for a clear uptrend or downtrend characterized by higher highs and higher lows or lower highs and lower lows.
- Confirm momentum using tools like MACD or moving averages.
- Draw Fibonacci Retracement:
- In an uptrend, draw from swing low → swing high.
- In a downtrend, draw from swing high → swing low.
- Wait for Pullback to Key Level:
- Focus on retracement levels of 38.2% or 50%, which often serve as high-probability support/resistance zones.
- Confirm Momentum:
- Ensure momentum indicators (RSI, MACD) align with trend continuation.
- Check volume for increased participation, signaling institutional or retail support at the level.
- Enter Trade with Risk Management:
- Place stop-loss just beyond the next Fibonacci level.
- Set profit targets based on previous swing highs/lows or Fibonacci extensions.
Traffic Domination Insight:
By entering during pullbacks with volume and momentum confirmation, traders maximize profit potential while controlling risk, fully leveraging market traffic signals for strategic domination.
2. Golden Ratio Strategy (61.8%)
The Golden Ratio Strategy focuses on the 61.8% Fibonacci level, widely considered the most critical retracement zone. This level often acts as a major reversal or continuation point, making it ideal for strategic entries.
Step-by-Step Execution:
- Identify Key Trend:
- Determine whether the market is trending up or down.
- Apply Fibonacci Retracement:
- Mark the 61.8% level between the recent swing high and low.
- Wait for Price Reaction:
- Observe whether the price respects this level as support or resistance.
- Confirm with Market Traffic:
- Volume spikes indicate strong participation.
- Momentum indicators should support reversal or continuation.
- Check for liquidity zones where stop orders may cluster.
- Enter Trade:
- Position yourself when the price reacts positively (in an uptrend) or negatively (in a downtrend) at the 61.8% level.
- Place stops slightly beyond the retracement zone for risk management.
Traffic Domination Insight:
The 61.8% retracement often signals key institutional activity, giving traders a strategic edge to capture high-probability moves and optimize profit while controlling risk.
3. Fibonacci Breakout Strategy
The Fibonacci Breakout Strategy focuses on price movement beyond a Fibonacci level, especially when accompanied by strong volume. Breakouts signal accelerated momentum and potential trend continuation.
Step-by-Step Execution:
- Identify Fibonacci Level:
- Draw retracement levels on a trending market.
- Monitor Volume:
- Strong volume is critical to confirm a legitimate breakout.
- Observe Price Action:
- Look for price closing beyond the Fibonacci level, not just momentarily touching it.
- Enter on Confirmation:
- After the breakout is confirmed with volume and momentum alignment, enter in the direction of the trend.
- Set Risk Management:
- Place stops below/above the broken Fibonacci level depending on trend direction.
- Target profits based on previous swing points or Fibonacci extensions.
Traffic Domination Insight:
Breakouts are powerful because they combine market traffic, liquidity, and momentum, allowing traders to capitalize on strong moves with strategic control over risk and optimized profits.
8. Risk Management with Fibonacci Levels
In trading, risk management is not optional—it is the cornerstone of long-term success. Even the most accurate technical analysis or high-probability Fibonacci strategy can fail without disciplined risk control. Using Fibonacci retracement levels allows traders to structure their trades with strategic entries, well-defined stops, and clear profit targets, aligning perfectly with the Traffic Domination philosophy of controlling risk and optimizing profits.
1. Defining Entry Points
Fibonacci levels provide logical zones for entering trades, reducing guesswork and emotional decisions.
- Uptrend Entry: Place trades near retracement levels such as 38.2%, 50%, or 61.8% where price is likely to find support.
- Downtrend Entry: Place trades near retracement levels where price may encounter resistance before resuming the trend.
Traffic Domination Insight:
- Look for alignment with volume surges, liquidity zones, and momentum signals.
- Enter trades only when all three traffic factors confirm the Fibonacci zone as a high-probability reaction area.
This approach ensures precise trade timing, giving traders strategic control over their positions.
2. Stop Loss Placement
Stops are critical for limiting losses and protecting capital. Fibonacci levels provide a logical structure for stop placement:
- Below the next Fibonacci level: In an uptrend, placing stops just below the next lower Fibonacci retracement protects against unexpected deeper corrections.
- Below swing lows or above swing highs: This ensures that stops are outside normal market noise, reducing the chance of being stopped out prematurely.
Traffic Domination Insight:
- Consider liquidity zones when setting stops. Institutional activity often creates short-term spikes near Fibonacci levels.
- Strategic stop placement allows traders to control risk while remaining in alignment with market traffic and momentum.
3. Take Profit Targets
Fibonacci levels also help define realistic profit targets, turning trades into disciplined, repeatable strategies:
- Previous Swing Highs/Lows: Use these as natural resistance or support levels to exit trades.
- Fibonacci Extension Levels: Project potential future price targets beyond the retracement zone (e.g., 127.2%, 161.8%) to capture extended trend moves.
Traffic Domination Insight:
- Align take profit targets with areas of historical liquidity and volume concentration.
- This ensures exits occur at points where the market is likely to react, optimizing profits while minimizing risk.
4. Structured Approach Improves Discipline
By combining Fibonacci retracement with entry, stop-loss, and take-profit planning, traders build a structured trading system that reduces emotional decisions.
Benefits of this structured approach:
- Enhanced Trading Discipline: Following pre-defined levels prevents impulsive entries or exits.
- Better Control Over Trades: Traders know in advance where to enter, where to cut losses, and where to take profits.
- Optimized Profit Potential: Targeting Fibonacci extension levels or swing highs/lows maximizes gains while maintaining a favorable risk-to-reward ratio.
Traffic Domination Insight:
Using Fibonacci levels as part of a risk management framework allows traders to dominate the market with strategy, control, and profit optimization, rather than reacting randomly to price movements.
9. Common Mistakes When Using Fibonacci Retracement
While Fibonacci retracement is a powerful trading tool, many traders misuse it, leading to poor trade decisions, unnecessary losses, and missed opportunities. Recognizing these common mistakes is crucial for maintaining strategic control and mastering Traffic Domination trading.
1. Using Fibonacci Without Trend Analysis
- The Mistake: Applying Fibonacci retracement in markets without a clear trend or in a sideways/consolidating market.
- Why It Fails: Fibonacci levels are designed to measure pullbacks within a trend, not predict random reversals in choppy markets.
- Traffic Domination Insight:
- Always confirm the market trend before drawing retracement levels.
- Use momentum indicators like MACD or moving averages to ensure trend direction aligns with your Fibonacci analysis.
- Impact: Ignoring trend context often leads to false entry signals and wasted capital.
2. Ignoring Market Context
- The Mistake: Trading Fibonacci retracement without considering economic news, events, or volatility spikes.
- Why It Fails: Technical levels may be temporarily invalidated during high-impact events like economic reports, interest rate announcements, or geopolitical shocks.
- Traffic Domination Insight:
- Always check the economic calendar and anticipate potential volatility that could override Fibonacci support or resistance.
- Combine technical analysis with market traffic signals—volume, liquidity, and momentum—to filter out noise from event-driven price swings.
- Impact: Ignoring market context can result in unexpected stop-outs or trend reversals, undermining your risk management plan.
3. Drawing Fibonacci Incorrectly
- The Mistake: Choosing the wrong swing high and swing low points when plotting Fibonacci levels.
- Why It Fails: Misplaced levels lead to inaccurate retracements, reducing the effectiveness of support, resistance, and entry zones.
- Traffic Domination Insight:
- Select major, significant swing points supported by volume and momentum for higher accuracy.
- Avoid minor price fluctuations that may distort retracement calculations.
- Impact: Poorly drawn Fibonacci levels create false signals, which can result in premature entries, poor risk-reward ratios, and missed opportunities.
- The Mistake: Relying solely on Fibonacci retracement without considering other market traffic signals.
- Why It Fails: Fibonacci levels indicate potential zones but cannot predict price reactions alone.
- Traffic Domination Insight:
- Always combine Fibonacci with:
- Volume analysis – confirms participation at key levels.
- Market structure – ensures retracements align with trends and key support/resistance zones.
- Momentum indicators – validates potential reversals or trend continuation.
- Always combine Fibonacci with:
- Impact: Trading Fibonacci in isolation can lead to low-probability trades, poor timing, and inconsistent results.
5. Avoiding Overconfidence
- The Mistake: Assuming Fibonacci retracement is infallible.
- Why It Fails: Even with perfect trend alignment and traffic confirmation, markets are influenced by unexpected liquidity events, institutional activity, or macroeconomic factors.
- Traffic Domination Insight:
- Use Fibonacci as part of a broader trading framework, integrating strategy, control, and risk management.
- Impact: Overconfidence often results in excessive risk exposure, undermining long-term profitability.
10. Conclusion: Mastering Fibonacci for Traffic Domination
Fibonacci retracement is more than just a technical tool—it is a strategic framework for understanding market behavior. By identifying potential support, resistance, and reaction zones, Fibonacci retracement provides traders with clear, actionable insights into where price is likely to pause, reverse, or continue its trend.
However, the true power of Fibonacci retracement is unlocked when it is combined with comprehensive market analysis under the principles of Traffic Domination:
1. Integrating Market Traffic
Traffic Domination emphasizes that trading success is driven by understanding market flow, which consists of:
- Volume: Confirms the strength and participation at Fibonacci levels.
- Liquidity: Identifies zones where institutional orders cluster, creating potential reversal or continuation points.
- Momentum: Validates whether price action supports trend continuation or a potential reversal.
When Fibonacci levels align with high traffic zones, traders gain a high-probability framework for entries, exits, and risk management.
2. Achieving Strategic Domination
Fibonacci retracement alone is not enough. To truly dominate markets, traders must combine it with strategic control:
- Strategy: Define a clear plan for entries, exits, and trade management based on Fibonacci retracement levels.
- Control: Maintain discipline by using stops, profit targets, and traffic signals to reduce emotional decision-making.
- Profit Optimization: Exploit the high-probability zones identified by Fibonacci and traffic analysis to maximize returns while controlling risk.
This approach turns Fibonacci retracement into a powerful decision-making framework rather than a simple charting tool.
3. Key Benefits of Mastering Fibonacci Retracement
By fully integrating Fibonacci retracement into your trading approach, you can:
- Identify High-Probability Entries: Recognize retracement zones where price is most likely to react, supported by volume, liquidity, and momentum.
- Manage Risk Effectively: Use Fibonacci levels for logical stop-loss placement and structured trade planning.
- Optimize Profit Potential: Target Fibonacci extensions, swing highs/lows, and volume-confirmed zones to maximize gains.
4. The Path to Market Domination
Mastering Fibonacci retracement is not about memorizing numbers—it is about understanding market behavior and integrating that knowledge into a disciplined, traffic-focused strategy.
By combining:
- Market Traffic → volume, liquidity, momentum
- Strategic Domination → strategy, control, profit optimization
traders gain a comprehensive framework for dominating markets intelligently and consistently.
Final Thought
Integrating Fibonacci retracement into your trading strategy moves you closer to mastering market dynamics. With disciplined execution, traffic-based analysis, and strategic control, you are no longer simply reacting to price—you are dominating it.
Fibonacci retracement, when used as part of the Traffic Domination methodology, empowers traders to enter high-probability trades, manage risk confidently, and optimize profits, ultimately building a structured path to long-term trading success.